Collecting Module Specific Debugging Information using IntelliTrace

I am sure by this time all of you already aware of what is IntelliTrace Debugging. Just to give a quick overview, IntelliTrace is a new features of Visual Studio 2010 Ultimate Edition. By default IntelliTrace is enabled . During  debugging in Visual Studio, IntelliTrace works  in the background and  collect debugging information automatically and stored them in IntelliTrace Log File (. iTrace File ) . You can use the log file at any point of time to see what happened exactly at background during your live debugging. To know more details, you can see my several articles published on IntelliTrace  and for step by step guide read “Debugging Application using IntelliTrace” from MSDN .

Using IntelliTrace you can capture module specific information. This is really helpful when you don’t want to debug certain modules during your debugging process. In this post I am going to discuss about how you can collect module specific information using IntelliTrace.

Few important tips that you should know while using ASP.NET Session

While working with ASP.NET web application you must be familiar with one of most important state management technique “Session”. If you want to do a quick refresh or want to know some thing more, please go ahead and read one of my article “Exploring Session in ASP.NET” published at Code Project. In this post I am going to share some important tips that might be useful.

Customizing Visual Studio Extension Icon in Visual Studio 2010

If you have deal with Visual Studio Extension ( VSIX) , you must have seen, after the extension installation default icons are predefined ( As shown in below image ). In this post I am going to describe how you can customize /change the default visual studio extension  icon and can provide your own icon over there.

10 ASP.NET Tips and Tricks

Here I am sharing 10 ASP.NET Tips and Tricks most of them related with Grid View Control

How to change GridView column alignments for dynamic data source ?

How to pass multiple values using GridView HyperLinkField ?

Displaying Custom Messages / Images with NULL Value in ASP.NET GridView

Display custom messages or images when there is no records in GridView Data Source

How to Display “Yes” or “No” Instead of Checkbox while binding Boolean value with GridView ?

How to expand specific Tree View Node programmatically in ASP.NET ?

Run ASP.NET Web Application from Command Prompt

 How EnableViewStateMAC Makes ViewState Secure ?

 Disabling button when performing some operation in ASP.NET

 How to remove a persistent cookies before Expiration time ?

To know more Tips and Tricks Follow @dailydotnettips and visit http://dailydotnettips.com

On a side note,  I would like to congratulate couple of my friends, first a key community contributor on WCF, Dhananjay Kumar  for renewing  Microsoft MVP – Connected System again for year 2011. He blogs at  http://debugmode.net/ and his twitter id @debugmode_ .  and second one  Krishna Chaitanya T for Microsoft MVP – Internet Explorer . He is a Web Geek, do lots of research on web technology. He blogs at http://www.novogeek.com/ and his Twitter ID @novogeek . Good job guys !!

Track Changes and Advance Scroll Mode in Visual Studio 2010

In the recent update of Visual Studio 2010 productivity power tool  there are few new interesting features introduced.   You can download the Productivity tool from http://bit.ly/9nybU6 .  There are certain new features like Quick Find which allows you find and advance find dialog option with in code editor with nice highlighting features, nice enhancement of add reference window. kunal chowdhury has some nice blog post where he talked about  above two new productivity tool features. You can find the post over http://bit.ly/hDa0si and http://bit.ly/grhGAI . In this post I am going to talk about another nice and most interesting features of Power Productivity Tool which “Enhanced Scroll Mode”.  

Programmatically Changing Session State Behavior in ASP.NET 4.0

Session is one of most important state management in ASP.NET. We can enable or disabled session state either in web.config or using @Page directive’s   EnableSessionState attributes. But there was no provision to change the session state at runtime till date in ASP.NET. But using  ASP.NET 4.0, we can change the session  state programmatically . The .NET 4.0 framework adds a new method SetSessionStateBehavior  to the HttpContext class for ASP.NET. This method required SessionStatebehavior  value to set the current session mode. To call SetSessionStateBehavior   simply create a new HttpModule by Implementing IHttModule and hook the BeginRequest event. Most important you can only use the SetSessionStateBehavior  until the AcquireRequestState event is fired, because AcquireRequestState  Occurs when ASP.NET acquires the current state  that is associated with the current request

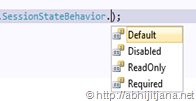
While calling SetSessionStatebehavior, You can pass the following values as SessionStatebehaimagevior  :

  • Default: This is default setting which means  everything works as before
  • Disabled: Turned of Session Sate for Current Request.
  • ReadOnly: Read only access to Session State;
  • Required: Enabled session state for both Read and Write Access;

New Features of IntelliTrace Debugging in Visual Studio 2010 – Service Pack 1 Beta

Visual Studio 2010 Service Pack 1 Beta having some great enhancement for IntelliTrace debugging. One of the most important features is debugging 64bit application with IntelliTrace  and also debug SharePoint projects using IntelliTrace. Apart from the above enhancement, there are some changes in saving of .iTrace Log files as well.  Earlier, by default, IntelliTrace  saves IntelliTrace log files (.iTrace files) to Trace debugging storage location and there was no option to enabled or disabled the log generation. But now, You can change the storage behavior of IntelliTrace log files, or you can manually save IntelliTrace log files from IntelliTrace Window. Here I am describing the procedures.

Debugging 64 bit application using IntelliTrace – Visual Studio 2010 Service Pack 1 Beta

IntelliTrace is an new features of Visual Studio 2010 Ultimate Edition. By default IntelliTrace is enabled . During  debugging in Visual Studio, IntelliTrace works  in the background and  collect debugging information automatically and stored them in IntelliTrace Log File (. iTrace File ) . You can use the log file at any point of time to see what happened exactly at background during your live debugging. One of most draw back of IntelliTrace was to support only 32bit Application. So, If you have are running your application in a 64bit Application, you have to debug your application in 32 bit mode to deal with IntelliTrace.  If you are trying to debug an 64 bit application using IntelliTrace you will get below  message in IntelliTrace Window.

image

Does IntelliTrace support all the .NET Frameworks ?

I have been asked this question many times and also found many people have some confusion around different supported version of .NET framework by IntelliTrace debugging. imageAs IntelliTrace is new features of Visual Studio 2010 Ultimate edition and VS 2010 came up with .NET 4.0, so many may got confused that IntelliTrace  only support debugging of .NET 4.0 features. But NO. IntelliTrace is available for .NET Framework 2.0 , 3.0, 3.5 and 4.0 . So, if you are creating any application (like Window, Console, ASP.NET)  with any framework from Visual studio 2010 you can use IntelliTrace Debugging. Even if, you have an earlier application which is based on .NET 3.5 or lesser and you are running it from VS 2010 Ultimate edition, you can enjoy the IntelliTrace features.  For an ASP.NET Application based on the targeted Framework version .iTrace log will be different. Generally for ASP.NET Application IntelliTrace log file name start with the name of the process which is handling the current request.

Tips : Set Breakpoint to multiple Functions at a same time in Visual Studio

Visual Studio having great features to set breakpoint in  multiple functions at same time.  For most of the time, to set a breakpoint  with in a function you just put a breakpoint in the first line of the function.  Now, assume you have 10 different overloaded methods or you have same function in different project, and you want to put breakpoint all of them or few of them, then it will take time to put breakpoint in each and every function.  In this post I am going to share two quick tips by which you can set breakpoint to function very easily. first one is by using “Break at Function” and second one by “Using Find Combo Box”.

How to Use ASP.NET “Property Pages” to create or host a Silverlight application in ASP.NET Site ?

While creating a Silverlight application in Visual Studio 2010, after providing the application name, IDE asked for whether you want to host the Silverlight application in a new ASP.NET web site or not. If you select the “Ok” button , Visual Studio will create a ASP.NET Site to host the corresponding Silverlight Application. So whenever you will run the Silverlight application, ASP.NET site will automatically host the Silverlight file  But suppose you have an existing Silverlight Application and you want to host it in a ASP.NET site in a similar way that New Silverlight project does  or you want to add a new Silverlight application which will automatically host inside your current asp.net web site? Do you know we can easily achieve this using “Property Pages” of an ASP.NET Application. Let’s explore how we can do that.

Silverlight Task Control For SharePoint 2010 – Example of High Touch Integration

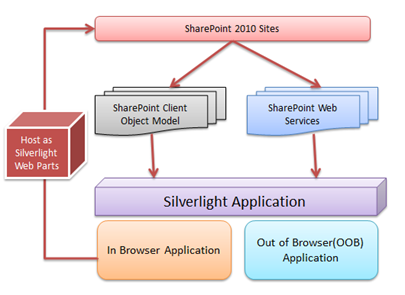
SharePoint 2010 supports fully integration with Silverlight application either of Silverlight In Browser  or as a Silverlight OOB ( Out Of Browser) aplications. In this blog post I am going to explain about High Touch Integration with Silverlight and Sharepoint using SharePoint 2010 Client Object Model (OM) with one example of Silverlight Task Lists for Sharepoint. I have also explained how to host a Silverlight web parts with in SharePoint using Sharepoint Out-Of-the-Box Silverlight Web Parts. As per my understanding below is the over all diagram for a High Touch Integration of Silverlight and SharePoint 2010

OverallHighTouch

From the above diagram we can see, that we have SharePoint Client Object Model (OM) and  Services, Which can be consumed by a Silverlight Application.  Object model and services is not only for Silverlight, you can use them for different client applications.

Different Version of Integrated Web Server in Visual Studio 2010

While running your ASP.net application you might have found it to be running on Integrated Web development environment. Visual Studio 2010 comes with two version of Integrated Web Development environment which could run side by side. In case you run your ASP.NET application in VS 2010 you can have an option to choose between the two version of Web Development environment, one running CLR 2.0, which was there before VS2010 and a new version of Web Dev with CLR 4.0. Multi – targeting allows you to configure your visual studio to run more than one Web Dev server at a time one using CLR 2.0 and another using CLR 4.0

In one of my ASP.NET Online session I had talked about the multi targeting features of Visual Studio 2010 for web development. During the demo I have shown, how we can target two different version of .NET CLR version same time. Some of the attendees having some doubts on that, So in this blog post, I am going to explain how we can target two different version of CLR at same time.

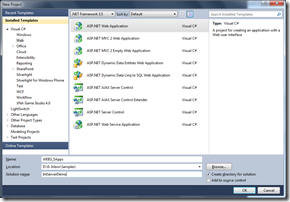
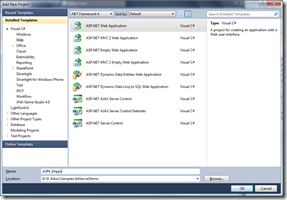
To demonstrate it, Start with a new Visual Studio Instance, and Create a solution file which contains two different Framework version of web applications.  Let’s say there are two web application which are targeting to ASP.NET 3.5 and ASP.NET 4.0 version.

1 2

Customize the Debugging Windows : Change Debugging Window View as per your requirements

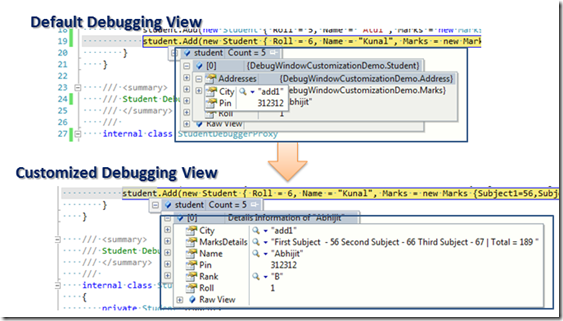
In this blog post I am going to explain how you can customize the complete view of the debugging window during debugging of application. By complete view means, where you can add own Properties, can customize the result, manipulate the data, hide properties which may not need during debugging etc. In one of my previous blog post, I have explained how we can customize the view of the debugging windows using DebuggerBrowseable and DebuggerDisplay attributes over Few Tips on Customizing Debugging Window View in Visual Studio . But, both these two attributes are limited to customize the view for a specific class and they can only show you the information for the particular class members . In this blog post you will see how we can create new view for some existing debugging view using “DebuggerTypeProxy” attributes. From the below snaps you can understand what kind of customization we can do inside a debugging window.

Overall