Customize the Debugging Windows : Change Debugging Window View as per your requirements

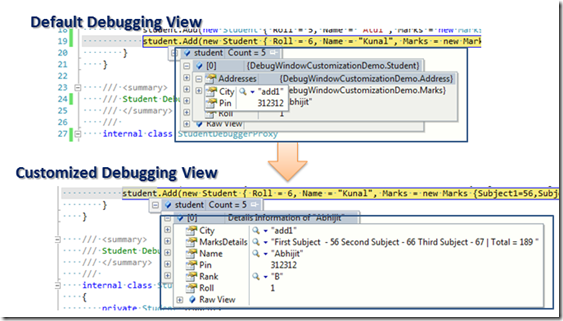
In this blog post I am going to explain how you can customize the complete view of the debugging window during debugging of application. By complete view means, where you can add own Properties, can customize the result, manipulate the data, hide properties which may not need during debugging etc. In one of my previous blog post, I have explained how we can customize the view of the debugging windows using DebuggerBrowseable and DebuggerDisplay attributes over Few Tips on Customizing Debugging Window View in Visual Studio . But, both these two attributes are limited to customize the view for a specific class and they can only show you the information for the particular class members . In this blog post you will see how we can create new view for some existing debugging view using “DebuggerTypeProxy” attributes. From the below snaps you can understand what kind of customization we can do inside a debugging window.

Overall

Tips on Debugging : Using DebuggerStepThrough attribute

In my few previous blog post I have explained  how we can customize the Debugging windows view during debugging of application using “DebuggerBrowseable “  attributes and “DebuggerDisplay” , then I have also explained use of “DubuggerHidden” attribute which tells the Visual Studio debugger that the method is hidden from the debugging process and while debugging. In this blog post I am going to explain one similar features of “DebuggerHidden” attributes, named “DebuggerStepThrough” 

Marking a piece of code using DebuggerStepThrough attribute tells the Visual Studio debugger that, the code block will be stepped over from debugging process. you can mark methods, properties with DebuggerStepThrough attributes where you don’t want to stop your code to break.

If there is any break point inside a code section which is marked as “DebuggerStepThrough” attributes, that code block will be marked as “[External code]” in stack Trace. Where as “Debugger hidden” attributes didn’t marked is External code.

overall

Color Indicator for Code Changes – Track Changes in Visual Studio 2010

Track Change” one of the best interesting features in visual studio which indicates the code changes with a color indicator at the beginning of the line.  Generally we know about the two color indicator  “Green” and “Yellow” which are used indicting the color change till VS 2008 along with those VS 2010 introduced another new color “Orange” which indicates some additional track change for undoing file after save. In this blog post I am going to explain how those color indicator helps developers to track the code changes.

In Visual Studio 2010, there is three color indicator

TrackChange_Green  Green color indicates the lines  which you have edited before your last save.  Save again the file and green mark will be disappear.

  TrackChange1

TrackChange_Yellow Yellow color indicates the lines which  you have edited since the  last save of that file.  Yellow becomes Green after saving of the file. Once you close the file that indication disappears.

 TrackChange2

TrackChange_Orange This color indication has newly introduced in VS 2010.  This color will come when  user does an undo after a save operation for that current file. Orange color indicates  that current changed line is different from the saved version of the file. 

 TrackChange3

Use “Obsolete” attributes to indicate Obsolete Methods

In this post I have explained how you can use Obsolete attributes to mark some methods which are not no longer in used or may be remove in future release of the class.  During the development cycle we may need to change the name or declaration  of certain methods which may be using by some other developers. In this case if you changed the name or declaration of that method, application may crash in different point of times as it’s being used by other developer in the application. In this case you can use System.ObsoleteAttributes  class to generate compiler warning and indicate the method as Obsolete.

1

Few Tips on Customizing Debugging Window View in Visual Studio

In this post I am going to discuss about few tips on customizing debugging debugging windows. This may be very helpful during debugging of application. While debugging, you may want to simplify debug window or you may want to clean up all the unnecessary fields that are not important during debugging from debugging windows.  Here is few tips for customization of debug window. 

lightbulb Use DebuggerBrowsable attribute to customize the debugging windows

2

lightbulb  Use DebuggerDisplay attribute to customize the debugging display.

 1


To use above attributes you have to use System.Diagnostics namesapce

How to suppress compiler warning using #pragma warning directives in Visual Studio

Sometimes during development you may need to avoid the unnecessary compiler warnings to show in warning window. Though it’s not recommended to suppress the warning explicitly, but during some debugging and analysis of code you may want to hide them for time being. In this post I have explained how you can hide the unwanted warning explicitly by specifying the warning number.

To suppress the warning you need to use #pragma warning directives in your code. Below is the syntax for the same.

#pragma warning disable <warning-Numbers>

[Line of Code ]

Let’s consider you are having the below code block and you want to suppress the warning messages.

1

If you are going to build the above code, you will find the below warning messages.

2

How to setup multiple startup projects in Visual Studio ?

In this blog post I am going to describe a small tips of visual studio where you will get to know how you can  launch multiple project at same time. This is quite useful when you are working on a solution which having multiple project type and you want to run few of  them in same time.

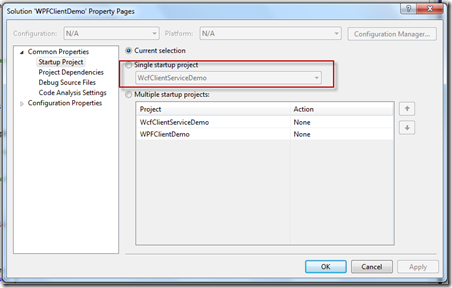
Let’s assume you have a frontend application which developed using WPF and in the backend you are calling a WCF Service. Now to test the application you need both of them on running stage. By default Visual Studio project Setup type sets to “Single Startup Project” . If you set any of the project as "Start up” then that project will start when you run the application.  So after that you need to run the second project also. Below is the Project setup window where you can find the all the setting related with project start up. You can open that window by right clicking on Solution” > “Properties” > “Common Properties” > Startup Project”

8-11-2010 2-33-47 AM

Now, if you look into the above picture you will find we have three options for project setup.

One of my favorite Visual Studio Shortcut- Very useful !

“Ctrl + .”  Or “ALT + SHIFT+F10” is one of my favorite shortcut in Visual Studio.   You can use the same shortcut for various situations as described in below.

1. Adding Namespaces Automatically / Resolve Namespaces.

2. Generate Method Stubs.

3. Implement Interface/ Abstract Class

4. Generate Automatic Class Files

5. Rename Member variables or Classes

Let’s start with one by one .

1. Adding Namespaces Automatically / Resolve Namespaces.

If you are adding a new class in your code, you may need to add the correspondence namespace. To do it, you may either manually type the Using Namespace, or you just right click on the class name and select Resolve > Namespace.  But using “Ctrl+.” you can automatically add the namespace in your code.

How to pass external values with GridView HyperLinkField which are not part of your Gridview DataSource member ?

Few days back I have published an article “How to pass multiple values using GridView HyperLinkField ?”,  where I have explained how you can pass multiple parameter with Gridview HyperLinkField using DataNavigationUrlField and  DataNavigateUrlFormatString properties. In this post, I am going to explain how you can pass some external values as parameters with the same hyperlink field.

DataNavigationUrlField use only those  fields as parameter which are the part of GridView DataSource. Now the problem comes when you want to pass some other variables as parameter which are not part of the DataSource.  As shown in below image we are passing EmpID and ParentId as argument and this two field are the data member of GridView DataSource.

GridField

Now Say, You want pass ChildID for that particular record along with ParentID and EmpID and you want hyperlink url should be like “Default.aspx?EmpID=1&ParentID=P1&ChildID=C1”where ChildID is not part of datasource.

You can achieve  this by writing code in code behind for the particular GridView. There is two events where you can overwrite the navigation url of that hyperlink field. You can use  Gridview_RowDataBound or Gridview_PreRender for the same.

How to hide Intellisense window in Visual Studio while coding or debugging to view the code?

Here is one quick tips to hide Visual Studio Intellisense window to view the covered source code by the particular Intellisense popup. When we are working in Visual Studio and the IntelliSense window comes up, but we may want to view the code that is covered by the window.  Here you go,  Press the Ctrl key. Intellisense window becomes transparent and you can easily view your source code. Hold the Ctrl as long as you want them to be transparent.  You can do it while debugging your application or writing code.

Below is the few snaps for the the same.

1. View Code By Hiding Intellisense Window During coding

CodeMode