IE Developer toolbar provide us a fantastic and easiest way to debug JavaScript with in browser. If the web site is hosted on IIS and you are trying debug JavaScript using IE Developer tool bar, it will work fine if you the correct browser setting for debugging. If you are running your web application directly from visual studio, you might came across the problem of “Unable to attach to the process” while click on “Start debugging” button in IE Developer toolbar. In this post I am going to talk about the resolution of the same and will also talk about little bit behind the scene.
Problem:
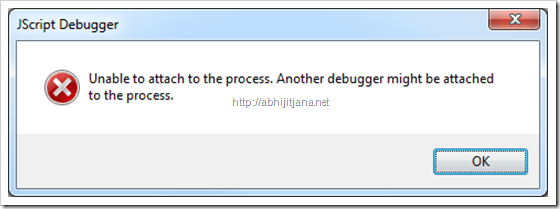
IE Developer Toolbar – JS Debugger Error “Unable to attach the process. Another debugger might be attached to the process” .
Steps :
1. Run an ASP.NET application from Visual Studio.
2. Once application launched, Press F12 in browser to launch Developer Toolbar.
3. Move to “Script” Tab and Click on “Start Debugging” . Put necessary breakpoints on the script function as required before click.

On click of “Start Debugging”, you will receive below error message. which says, already another debugger attached and you can not attach with current IE Process for debugging.

Solution :
Follow the below steps for resolve this issue.
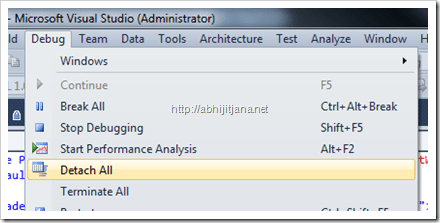
1. Go back to Visual Studio and Select “Detach All” from “Debug” menu.

2. Now click on “Start Debugging” from IE Developer Toolbar. No error , and you can continue with debugging and other work.
Behind the scene :
Visual Studio automatically instantiate an Internet explorer process to launch the web sites. You can check the process level using “Process Explorer”.

Also, it attached the process “iexplore.exe” automatically during launch of site that helps us debug JavaScript from visual studio itself. You can check it from Solution explorer itself

Which mean, while your site is running in browser, “iexplore.exe” ( Process for Internet Explorer) is already attached . One of the most simplest way to check this out is, navigate to Debug > Windows> Processes . This will list out all attached process with in visual studio . For any typical ASP.NET web application which is running from visual studio will have two process and iexplore is one of them.

That’s why when you are trying to attach the same process from IE Developer tool bar, it is throwing error “Unable to attach the process. Another debugger might be attached to the process” .
So now we know what was the causing the issue and let’s have a look what we did to resolve this.
As a resolution, we used “Detach All” from debug menu, which actually detach all the process which is attached with visual studio except local ASP.NET Development server process ( WebDev.WebServer40.EXE ).
Note : “Detach All” will detach all the attached process apart from ASP.NET Development server. Because detaching the development server is nothing but stopping your application. If you want to stop, either stop debugging or “Terminate” the local development sever process.
“Detach All” will remove iexplore.exe from the list of attached process. So, you can go ahead and start the debugging in IE Developer toolbar.

Detaching a Particular Process Instead “Detach All”
If there are multiple processes attached and if you want to detach only “IE Process”, you can simply do it from process attach window, by selecting “Detach Process” from the content menu of the “iexplore.exe”. This will help you to retain on other process in attached state.

To know more about Processes Window, check out this post How to get list of attached processes in Visual Studio while debugging ?
Hope this helps !
Cheers !
Abhijit

Nice article , so many time I face this problem
LikeLike
I have done all this and now I don’t get the “Unable to attach the process to debugger”, but, when I press Start debugging, nothing happens at all, the execution point doesn’t place at my Javascript Breakpoint..
LikeLike
greate article… It helps me lot…
LikeLike