Blog

Download PPT and Sample Code – Microsoft CTD – Hyderabad – 18th Dec 2010

Now, You can download the PPT and Sample Code for my Session on “ASP.NET 4.0 State Management Improvement – Deep Dive” 

Download

Also check out the My CTD Session Summary

My Session Summary – Microsoft Community Tech Days – 18 Dec 2010 – Hyderabad

During the Session, I have talked about IntelliTrace debugging and found many people having interested on the same.  You can check out my Virtual Tech Days Presentation on Debugging Web Application using IntelliTrace

For any Quick Update and Question You can follow me at @AbhijitJana

Let me know if you still have any questions.

Thanks !

AJ

My Session Summary – Microsoft Community Tech Days – 18 Dec 2010 – Hyderabad

Community Tech-Days (CTD)  is a Microsoft technology event organized by Microsoft and Local Slide1 Microsoft User Groups  to help developers and IT Prof. to catch up with the latest Microsoft  technologies. Hyderabad Community Tech Days was held on 18th December at Microsoft IDC Building , Microsoft Campus, Hyderabad.  Event was full of  large number of technology enthusiasts and a number of regular event speakers from various technologies present for the event. Audience was awesome. Overall 350+ attended this event for both the Developer and IT Track  and many more via live streaming. Live streaming was available only for developer track. I have presented a session on “ASP.NET 4.0 State Management Improvement -  Deep Dive” .

Microsoft Community Tech Days – Hyderabad – 18th December 2010

Microsoft Community Tech Days in Hyderabad Scheduled on 18th December 2010. This time I will be speaking on one of my favorite topic “ASP.NET 4.0 State Management Improvement – Deep Dive”.

What is Community Tech-Days?

The Community Tech-Days website says “Dive deep into the world of Microsoft technologies at the Community TechDays and get trained on the latest from Microsoft. Build real connections with Microsoft experts and community members, and gain the inspiration and skills needed to maximize your impact on your organization while enhancing your career”

Community Tech-Days (CTD)  is a Microsoft technology event organized by Microsoft and Local Microsoft User Groups  to help developers and IT Prof. to catch up with the latest technologies and development methodologies.

New Features of IntelliTrace Debugging in Visual Studio 2010 – Service Pack 1 Beta

Visual Studio 2010 Service Pack 1 Beta having some great enhancement for IntelliTrace debugging. One of the most important features is debugging 64bit application with IntelliTrace  and also debug SharePoint projects using IntelliTrace. Apart from the above enhancement, there are some changes in saving of .iTrace Log files as well.  Earlier, by default, IntelliTrace  saves IntelliTrace log files (.iTrace files) to Trace debugging storage location and there was no option to enabled or disabled the log generation. But now, You can change the storage behavior of IntelliTrace log files, or you can manually save IntelliTrace log files from IntelliTrace Window. Here I am describing the procedures.

Debugging 64 bit application using IntelliTrace – Visual Studio 2010 Service Pack 1 Beta

IntelliTrace is an new features of Visual Studio 2010 Ultimate Edition. By default IntelliTrace is enabled . During  debugging in Visual Studio, IntelliTrace works  in the background and  collect debugging information automatically and stored them in IntelliTrace Log File (. iTrace File ) . You can use the log file at any point of time to see what happened exactly at background during your live debugging. One of most draw back of IntelliTrace was to support only 32bit Application. So, If you have are running your application in a 64bit Application, you have to debug your application in 32 bit mode to deal with IntelliTrace.  If you are trying to debug an 64 bit application using IntelliTrace you will get below  message in IntelliTrace Window.

image

Does IntelliTrace support all the .NET Frameworks ?

I have been asked this question many times and also found many people have some confusion around different supported version of .NET framework by IntelliTrace debugging. imageAs IntelliTrace is new features of Visual Studio 2010 Ultimate edition and VS 2010 came up with .NET 4.0, so many may got confused that IntelliTrace  only support debugging of .NET 4.0 features. But NO. IntelliTrace is available for .NET Framework 2.0 , 3.0, 3.5 and 4.0 . So, if you are creating any application (like Window, Console, ASP.NET)  with any framework from Visual studio 2010 you can use IntelliTrace Debugging. Even if, you have an earlier application which is based on .NET 3.5 or lesser and you are running it from VS 2010 Ultimate edition, you can enjoy the IntelliTrace features.  For an ASP.NET Application based on the targeted Framework version .iTrace log will be different. Generally for ASP.NET Application IntelliTrace log file name start with the name of the process which is handling the current request.

Add document header for files automatically in Visual Studio

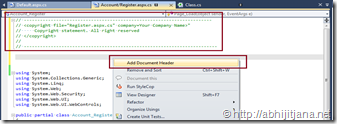
In this blog post I am going to share  how you can add a document header imageof xml comments with code file automatically. This is going to be an very interesting and helpful for all of you who are using styleCop to maintain coding standard. Actually extensive using of StyleCop helped me to think to make it automate. There are many tools available which can helps us in this case to do this automatically. But I always prefer let’s Visual studio do the job for me.  Here I am going to share with  you two different approaches to deal with this issue. Now it’s up to you which one to use.

Tips : “Remove and Sort” Namespaces using Shortcut in Visual Studio

While dealing with maintaining coding standard like stylecop warning fix with code, most of the time we need to remove unused namespaces and sort the namespaces.  We can do it easily from the context menu of  the code editor. There you have three different option for  “Organize Using” .  Either you can Remove Unused Usings , Sort Usings or we can do it together by selecting “Remove and Sort” .  Let’s see how we can make it more handy !

Tips : Set Breakpoint to multiple Functions at a same time in Visual Studio

Visual Studio having great features to set breakpoint in  multiple functions at same time.  For most of the time, to set a breakpoint  with in a function you just put a breakpoint in the first line of the function.  Now, assume you have 10 different overloaded methods or you have same function in different project, and you want to put breakpoint all of them or few of them, then it will take time to put breakpoint in each and every function.  In this post I am going to share two quick tips by which you can set breakpoint to function very easily. first one is by using “Break at Function” and second one by “Using Find Combo Box”.

How to use out of scope object with in Conditional Breakpoint ?

During debugging of your application, you may need to keep track of some data which are already out of scope. Say, You call a MethodB() from MethodA() and did some operation inside MethodB(), now when you returned  back to MethodA(), all the local variables inside MethodB() are out of scope. But  you want to use them in MethodA(). Now here is the trick, that you can create an ObjectID for an member variables or objects and can track the same when it’s out of scope as well, but until GC() does not collect it.  In this post, I am going to explore how we can use an Out of Scope object value to deal with Conditional Break points. To start with, first you have to understand how to use Object ID to track and out of scope object. Here is my complete article How to track an object which is Out of Scope while Debugging ? . Though I described a quick look into use of out of scope object inside conditional breakpoints on that article,  I received few query about more details on the same. So here I am going to give some more details.

Microsoft Community Tech Days – Kolkata – 28th November 2010

Community Tech-Days (CTD)  is a Microsoft technology event organized by Microsoft and Local Microsoft User Groups  to help developers and IT Prof. to catch up with the latest Microsoft  technologies. Kolkata Community Tech Days was held on 28th November at Moksh Auditorium, Camac Street, Kolkata.  The event was full of  large number of technology enthusiasts and a number of regular event speakers from various technologies present for the event. It was a great pleasure for as well  to be there as an speaker.

Download PPT – “Debugging Web Application Using IntelliTrace” – Virtual Tech Days – 22nd to 24th November 2010

Today I delivered an 1 hour session on “Debugging Web Application using IntelliTrace”  in Microsoft Virtual Tech days 2010. It was the Day 2  of Virtual Tech Days and I presented the 5th session Slide on Developer Track 1, from 4.15 PM To 5.15 PM IST. Thanks to all of you for attending my session. In this session I discussed about IntelliTrace Debugging, which is  one of the most exciting features of Visual Studio 2010 Ultimate edition. I started with fundamentals of IntelliTrace debugging and then move to the topic “How it works? “.  After that I have shown one complete demo on different settings like X86, Any CPU configuration, ASP.NET Events, gesture for ASP.NET, file access settings and also shown how to use IntelliTrace in different aspect of debugging ASP.NET Application. After that, Session was all about ASP.NET Developers, where I explained about Tracking ASP.NET Page Life Cycle using IntelliTrace, Dealing with HTTP Modules using IntelliTrace. I had also explained in different naming convention for  .iTraceLog File for Worker Process, Webdev.webserver20.exe ( Targeting CLR 2.0 ) and webdev.webserver40.exe ( Targeting CLR 4.0 )  with demo. Yes, this was really interesting. Finally I have explained about IIS Request processing and using IntelliTrace to get info out of it. Also described how you can debug you application using   from IIS.

Microsoft Virtual Tech Days – 22nd To 24th November 2010

The 10th edition of Virtual TechDays – being held on 22-24 November, 2010. I am gladVTD to say that I will present a session on “Debugging Web Application using IntelliTrace” on 23rd November from 4.15 PM To 5.15PM IST. In this session I will explore one of the coolest and most important features of Visual Studio 2010,  IntelliTrace debugging and will show you demo on how we can use this features for an ASP.NET  web applications. This is an live meeting event. You can attend it from any where.  To register for this event click here . Find all the details agenda from here . Tune in for a demo filled session.

How to Use ASP.NET “Property Pages” to create or host a Silverlight application in ASP.NET Site ?

While creating a Silverlight application in Visual Studio 2010, after providing the application name, IDE asked for whether you want to host the Silverlight application in a new ASP.NET web site or not. If you select the “Ok” button , Visual Studio will create a ASP.NET Site to host the corresponding Silverlight Application. So whenever you will run the Silverlight application, ASP.NET site will automatically host the Silverlight file  But suppose you have an existing Silverlight Application and you want to host it in a ASP.NET site in a similar way that New Silverlight project does  or you want to add a new Silverlight application which will automatically host inside your current asp.net web site? Do you know we can easily achieve this using “Property Pages” of an ASP.NET Application. Let’s explore how we can do that.